
Graphs are graphical drawings that show the relationship between two or more elements. Google Docs has proved to be an effective tool in constructing graphs. Other than saving time, graphs drawn using Google Docs tools are more presentable and attractive as the inputted data is directly converted to a graph. Also, Google Docs software is fitted with a variety of graph types, and users can select the one that suits his/her data best.
Here’s the step to construct graphs using Google Docs:
1. Open Google Docs
Using any suitable browser, open the Google Docs software. A user email account will be needed to use this tool. Therefore, log in using a relevant email account. While you’re logged in, go to docs.google.com.
2. Open a New spreadsheet
Once the Google doc is opened, locate and click on the “black document” that is symbolized by a large rainbow plus sign. If you are working on an already existing document, go to your Google Drive and open the document from there, then proceed to add a graph in the document.
3. Input the graph’s details
Any graph is a result of values and other details. On the blank cells, input the details of the graph to be generated.
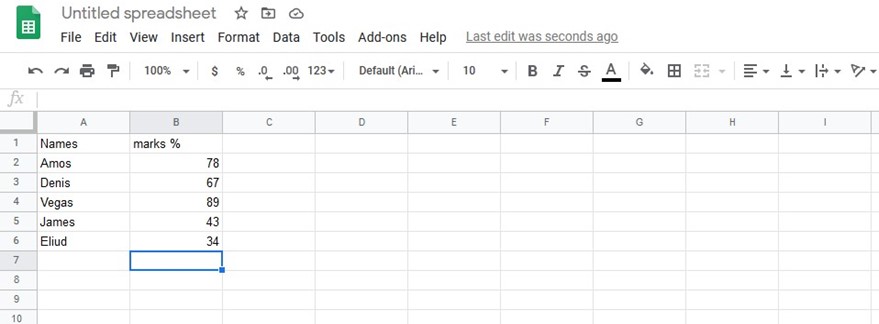
Note: carefulness should be observed when feeding the cells with data to avoid omission or inputting wrong values.
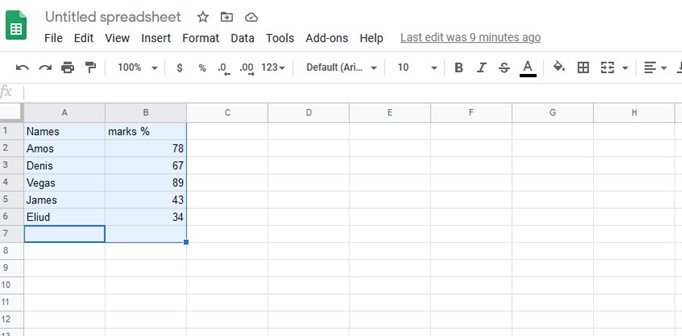
4. Highlight the Graph’s details
Once you’ve inputted all the required data, highlight all the data that will appear in the graph.
5. Click the insert button
After highlighting, locate the “insert tab” on the top part of the page, click on it. A dropdown menu opens. On this menu, locate and click on the chart button.
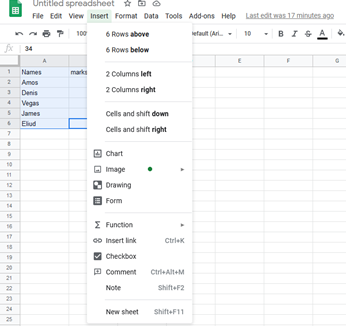
The “chart” is a general name that is used to represent various types of graphs and charts.
6. Editing the graph
On clicking the “chart” button, Google suggests the best type of graph that fits your data, and it is automatically drawn on the sheet opened. However, Google Docs allows its users to change the type of graph. This is achieved through its chart editor feature that is found on the rightmost side of the graph drawn.
You can choose the type of graph you want by clicking the “chart type” menu, i.e., chart editor>chart type.
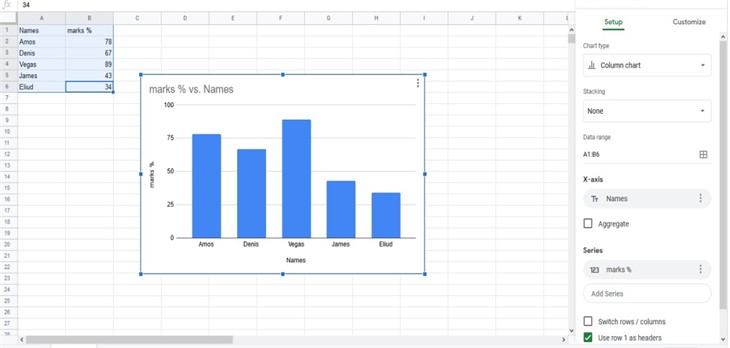
Also, the appearance of the graph can be altered in this section. That is, the values found on the x-axis and y-axis are determined by the “Chart editor” section.
7. Customization of the graph
Now the graph is correctly drawn and designed. However, the user may decide to alter with position, size, or even the background color of the graph; this is all done here. By using the cut feature (ctrl+x), the graph can easily be moved from one location to another. Similarly, the graph can either be stretched outwards (maximize) or inwards (minimize) depending on the size that meets the user’s desires.
Therefore, using the above pretty simple steps, anyone can construct a graph on Google Docs without experiencing any problem.