
Google sheets are an alternative online Excel spreadsheet found in Googles’ web browser which allows users to key in data and does analysis just like in Microsoft excel. Its advantage is that unlike Microsoft Excel, your data is automatically saved in google drive thanks to the newly added macros hence no risk of losing data even when the power goes off. Besides, it has automated and simplified formulas to do calculations and perform other activities making it more viable. Furthermore, one can invite others to work on the spreadsheet with you. Also, it gives you the opportunity to make changes to the file without having to destroy the original document. When you are done making changes, you can simply download it where sheets are going to convert it back to excel files, ready to be used by Microsoft excel once again.
Most of the time when working with data on google sheets you will be required to create a Pie Chart to make your data more presentable, easy to understand, and draw better conclusions. Organizations use graphs from previously analyzed data to make decisions on certain important issues affecting them. Researchers as well as use graphs to explain the prevalence of a certain problem as well as perform statistical predictions on the future of such issues. Google Sheets allows users to create graphs from their data through their chat features.
The chart feature in google sheets is a useful tool which can change a bulky data into a digestible format.
In a simple and quick way, I will use screenshots to explain how to create a Pie Chart in google sheets.
Steps for creating a pie chart in google sheets
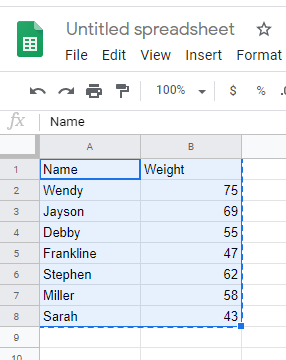
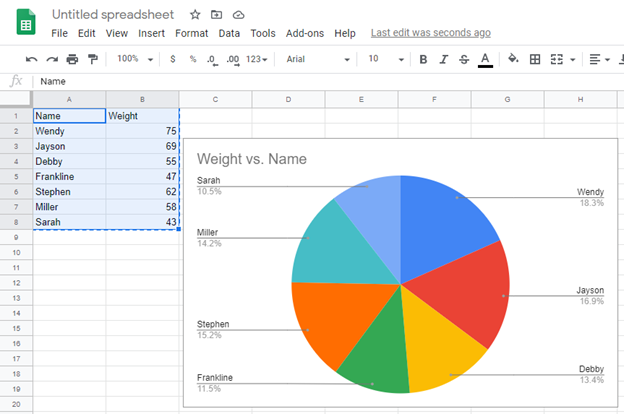
1. First, ensure you have keyed in the right data in google sheets. Select the data to be used in the graph.
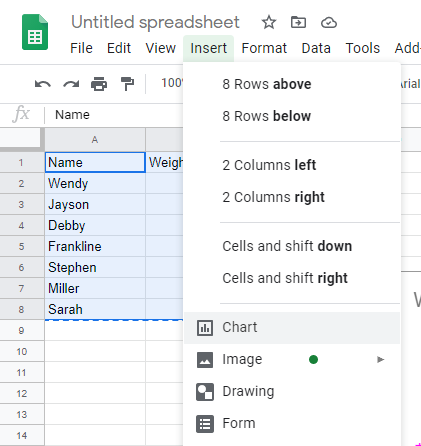
2. On the menu bar, click Insert and select Chart.
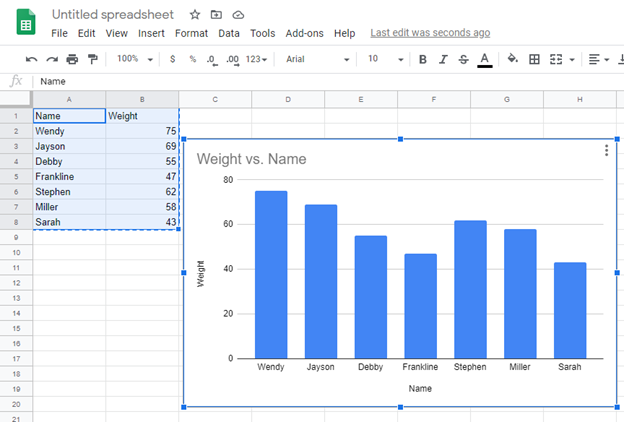
Google sheets automatically generate a graph as shown below.
3. On the right side of the screen, click Setup then selects the graph of your choice from a range of selections ranging from line graphs, bar graphs, scattered graphs, column graphs, etc.
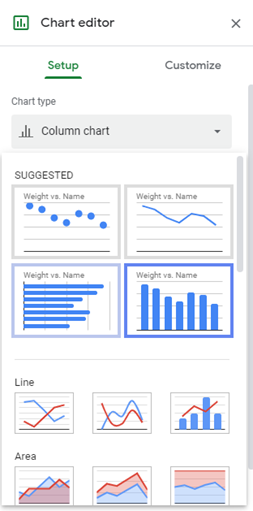
In our case, change the type of graph to Pie chart by clicking on Pie chart option.
Google sheets allow you to customize your chart further in the menu found in the dialogue box which shows when you double click inside the cart. This feature allows you to change the data range.