
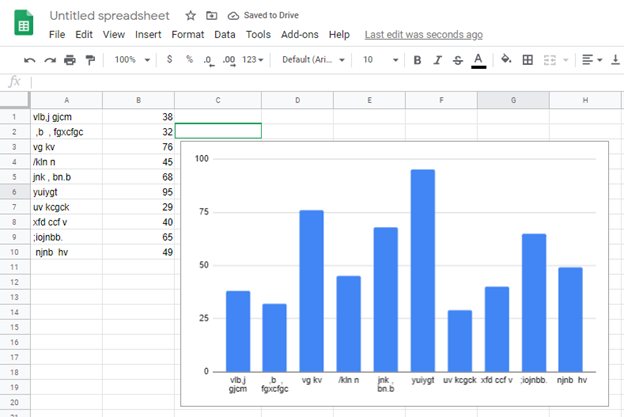
Google sheets is an online web browser spreadsheet which allows users to key in data and do analysis. The chart feature in google sheets is a useful tool which can change a bulky data into a digestible format. In a simple and quick way, I will use screenshots to explain how to create a bar graph in google sheets.
Steps to create a bar graph
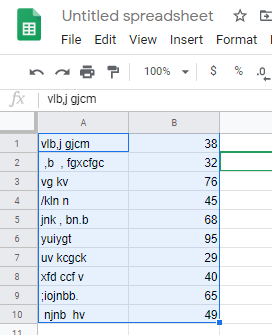
1. Highlight the data to be used in the bar graph.
2. On the menu bar, click insert and select chart.
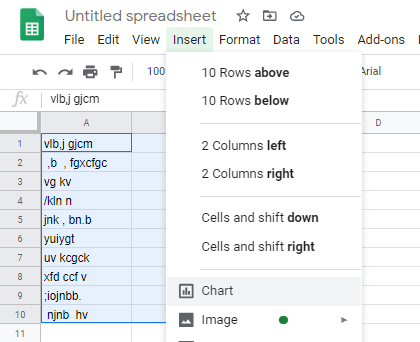
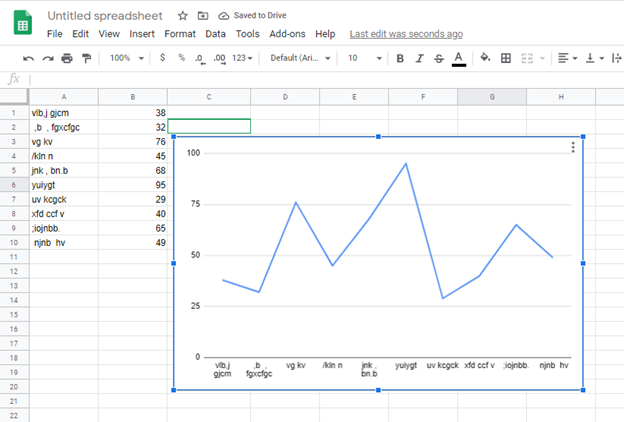
3. Click insert and then select chart, automatically google sheet displays a chat.
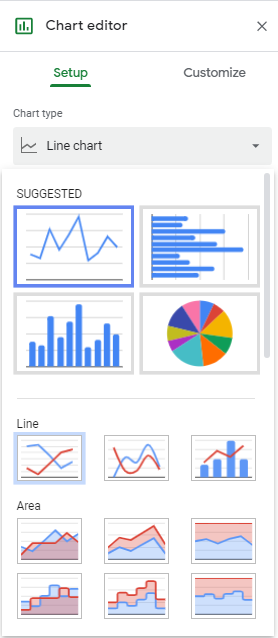
4. On the dialogue box in the far right, click set up click the box just below “Chart type” to Change chart type
Google sheets allow to customize your chart further in the menu found in the dialogue box which shows when you double click inside the cart. This feature allows you to change the data range as well as switch columns and rows if applicable.