
Flowcharts are visual diagrams or schematics that use symbols to represent information. Google Docs software has in-built features vital in the construction of flowcharts used by various groups.
Let discuss the two methods that are used in creating flowcharts in Google Docs:
Using the Drawing Tool
Here are the steps to be followed in this method:
1. Launch Google Docs
Navigate to docs.google.com using any suitable browser; make sure you’re logged in to your email account.
Click the “Blank Document” symbolized by a large rainbow plus sign to open a new document.
2. Open the Drawing tool
On the blank document opened, a ribbon on the top has tabs, locate and click on the Insert tab. On the Insert dropdown menu, select the “Drawing” button.
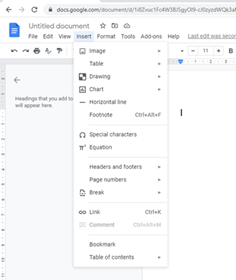
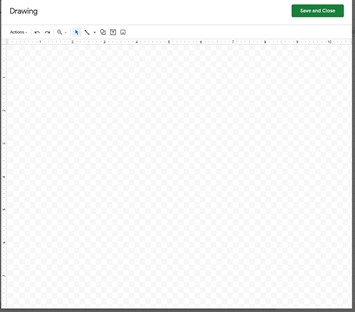
A pop-up drawing box opens.
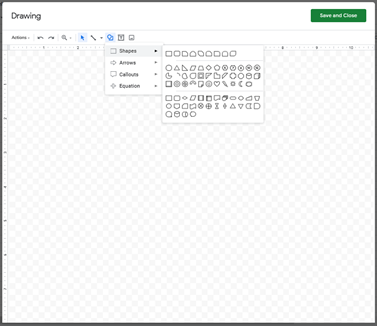
3. Add the Flowchart Shapes
The Google Drawing tool has various shapes, and therefore, the user has a wide range of choices. From the “Shapes” button, select the shape you need to insert into your document. Resize and position it within the drawing panel.
If you want to use one shape more than one time, you may use the copy and paste feature. That is, copy the already selected shape and paste it where you need to use it.
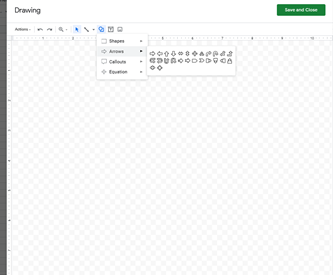
4. Add Arrows to the flowchart
To make the flowchart complete, you need to connect the inserted shapes with arrows. These arrows are found on the “Arrow” menu within the ribbon of the Drawing page. From the “Arrow” dropdown, select the type of arrow that fits your transition from one shape to another.
5. Add information on the flowchart
To add text in shape, click the “Text box” denoted by “T.” Then, add the details in each shape/arrow to your chart. Also, you can format your text; click the three dots found in the ribbon and choose the option you want.
6. Save the Flowchart
Finally, click the “Save and Close” button. Your flowchart will automatically be added to your document. You can now print or download the document containing the flowchart by accessing it from your Google Drive.
Using Lucid-chart
Lucid-chart is third-party software that is used to create a chart and insert them in your document.
Here are the steps to use this feature:
1. Launch Google Docs
Navigate to docs.google.com using any suitable browser; make sure you’re logged in to your email account.
Click the “Blank Document” symbolized by a large rainbow plus sign to open a new document.
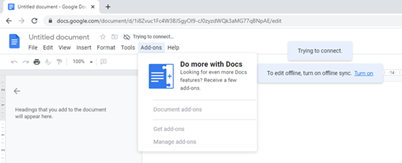
2. Click on the Add-ons
On the ribbon, click on the “Add-ons” tab, then tap the “Add-ons” button.
3. Activate the Lucidchart
On the “Add-ons,” find and select the lucid-chart. Login into it and allow the software to access your document.
4. Create a flowchart
In the lucid-chart, click the orange “+” button located at the bottom of the page. You can then select a blank page or choose a template to customize. Drop and drag shapes, and then add your text.