A bar graph simply is a type of graph that is used to display data with the use of bars of different heights. Each of the bars in the chart represents different categories of the variables on the chart display. A bar chart is majorly used to show a comparison of various variables or data.
Steps to making a bar chart in google sheets
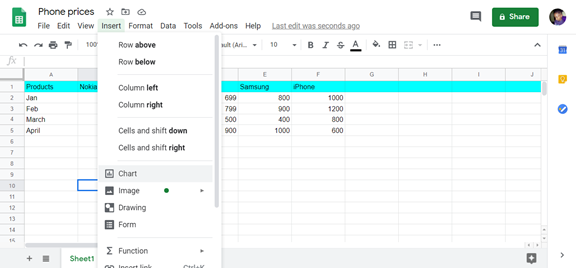
1. Go to google sheets .com, open a spreadsheet and enter your data
2. Go to the google sheets toolbar, select “insert”
3. Click on the “Chart ” and a chart editor will open
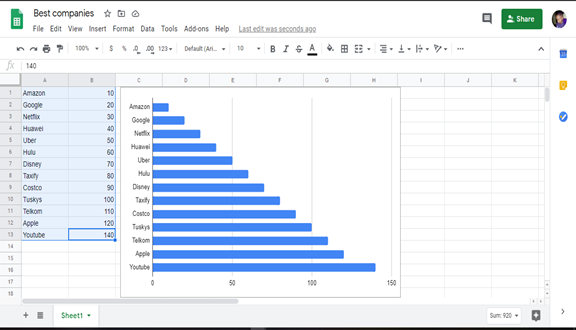
4. Choose a chart type of your choice under “Chart type” dropdown menu
5. Enter the data range containing the data for your chart
6. Automatically display the highlighted data in your spreadsheet to a bar chart
Alternatively
One can use the above-mentioned steps where you click on insert, then chart to get a chart editor where one selects a chart type and the bar chart automatically gets displayed. Alternatively one can use three simple steps to achieve the same results.
Steps of making a bar chart in google sheets
1. Open your spreadsheets in and enter your data
2. Highlight the data you want to be included in the bar chart
3. Go to the toolbar and select insert
4. Click on “chart” under” insert”
5. A pop-up chart menu appears, click on “Chart type” dropdown
6. Go through the bar and select a bar chart that best suits your data
How to customize a bar chart in google sheets
This is optional that is if one wants to change the way his or her graphs look like. This helps one’s work to be easier to use as well as read.
1. Click on the “customize” tab
Ensure that the chart editor is open if not you can open it again through;
Double click on the chart and the chart editor opens.
2. Under the customize tab, different menus appear and click on any to change, for example; click on chart style to change the background color and the font type.